By Marie Woodward, UConn Home & Garden Education Center
If you are wondering whether that shrub, flower, or tree that you saw in a magazine or catalog will grow well in your garden, using a hardiness zone map is your best bet to ensure success.
A hardiness zone map is a tool that divides a geographical area into distinct zones based on average annual minimum winter temperatures. These maps are used by gardeners and farmers around the world to determine which plants are most likely to thrive in a particular region. Each country has its own hardiness map that correlates to their climate. In the United States, the USDA publishes a hardiness zone map, which covers all fifty states and includes Puerto Rico, Guam, American Samoa, and the U.S. Virgin Islands. It uses climate data collected over many years from weather stations throughout a specific region. Then the data is analyzed to determine average minimum winter temperatures from different areas.
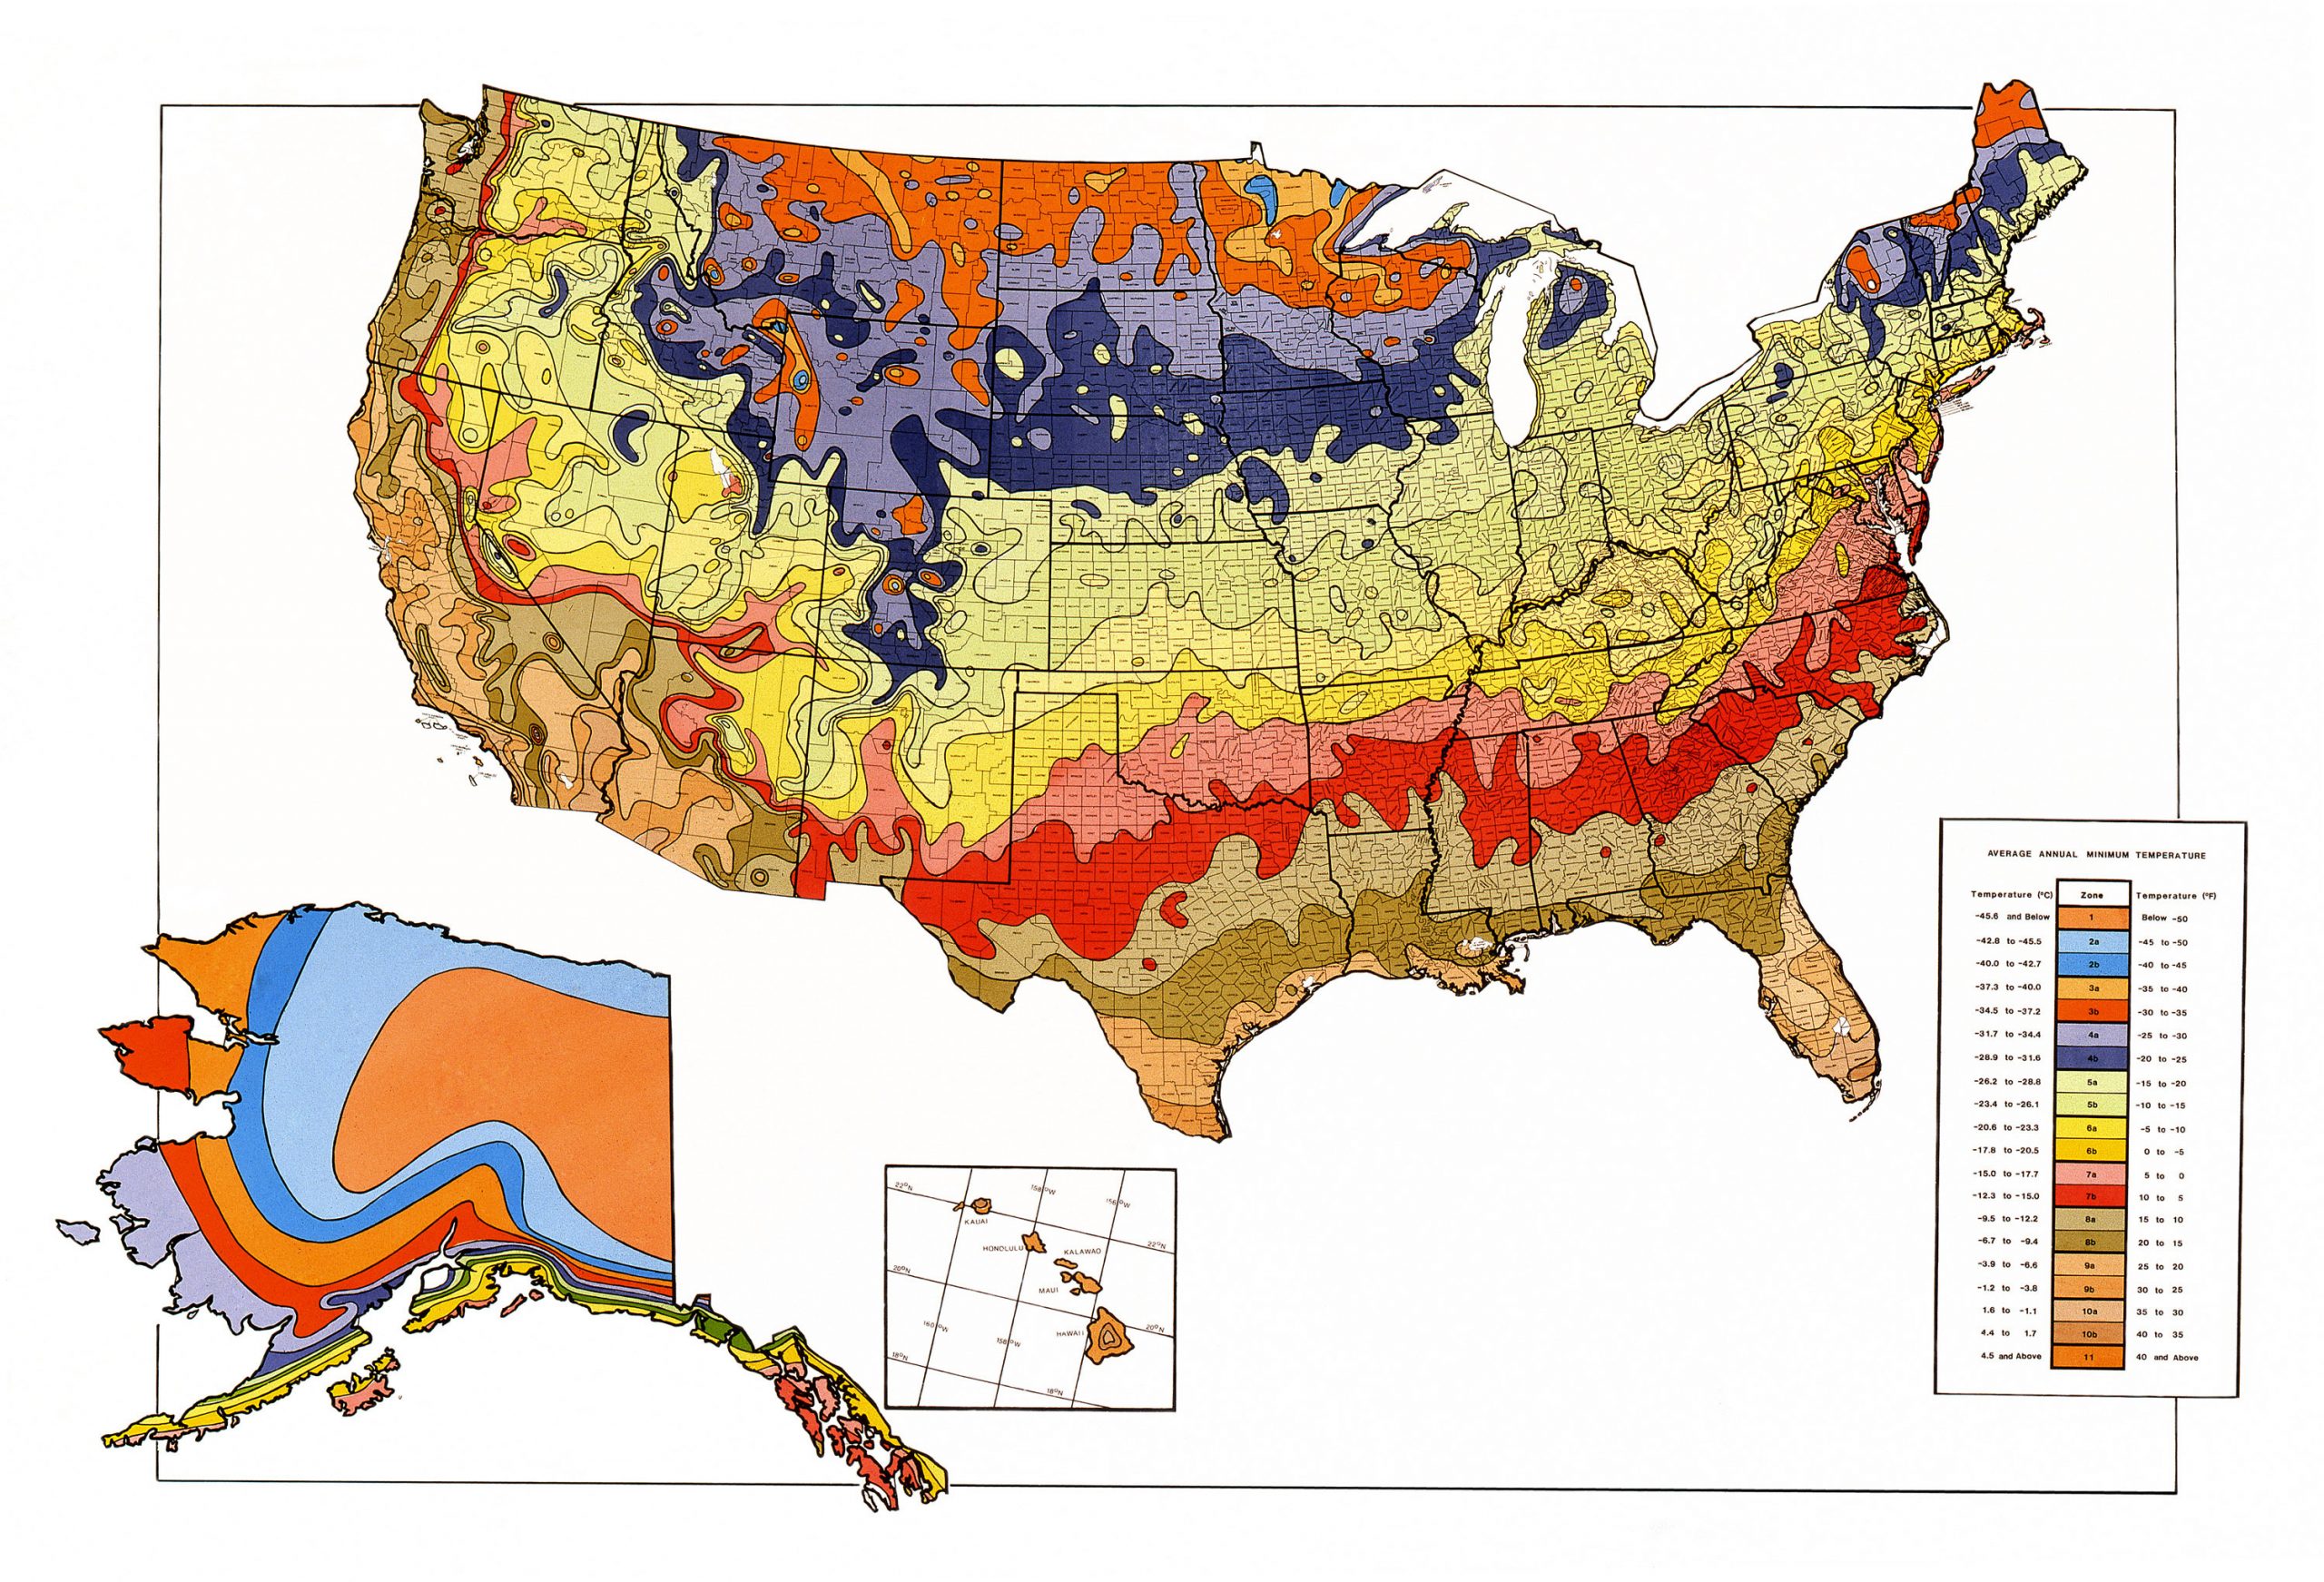
The concept of hardiness zones was first introduced in 1927 by Dr. Alfred Rehder. Rehder worked at Harvard's Arnold Arboretum as a botanical taxonomist. He wanted to address the challenges gardeners and growers faced in selecting plants suited to their local climate. Prior to Rehder’s map, there was no standardized system for categorizing plants based on their ability to survive winter temperatures. His hand-drawn map featured eight hardiness zones and was based on the lowest winter temperatures recorded in various regions across the country. Rehder aimed to provide a practical tool for gardeners and growers. His map made it easier for them to choose plants with the best chances of survival in their region, ultimately contributing to more successful gardens and agricultural endeavors. Rehder’s innovative approach recognized the importance of adapting agricultural practices to local climates. In the 1960s, the USDA adopted and adapted Rehder's concept, creating the first official USDA Plant Hardiness Zone Map.
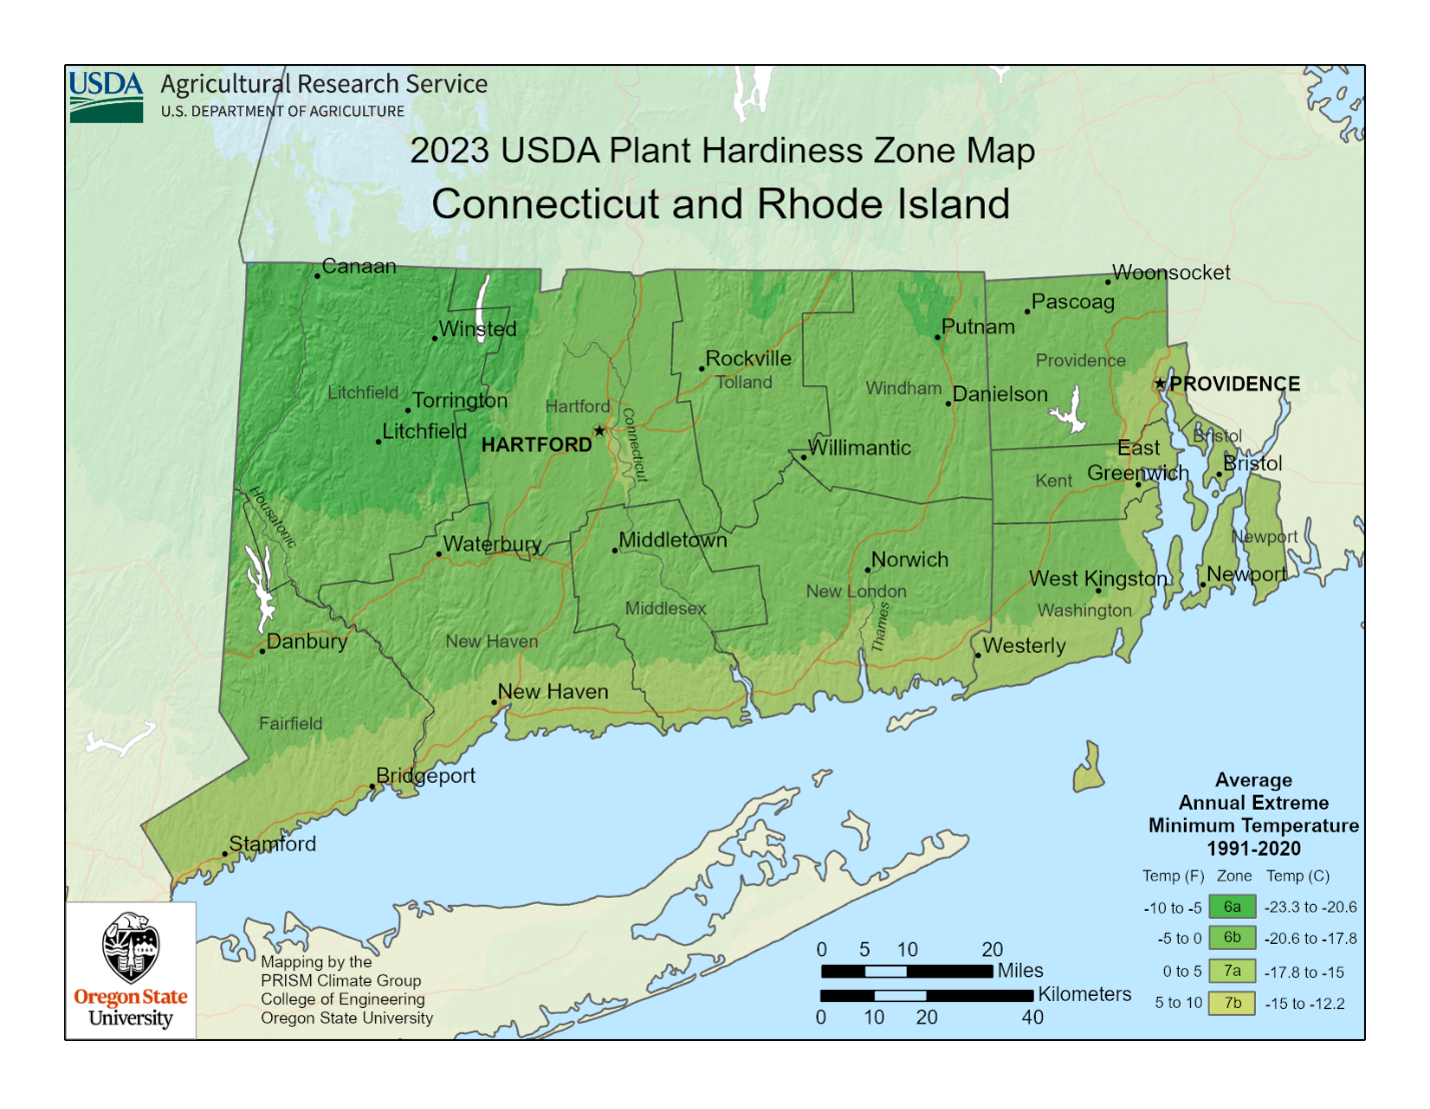
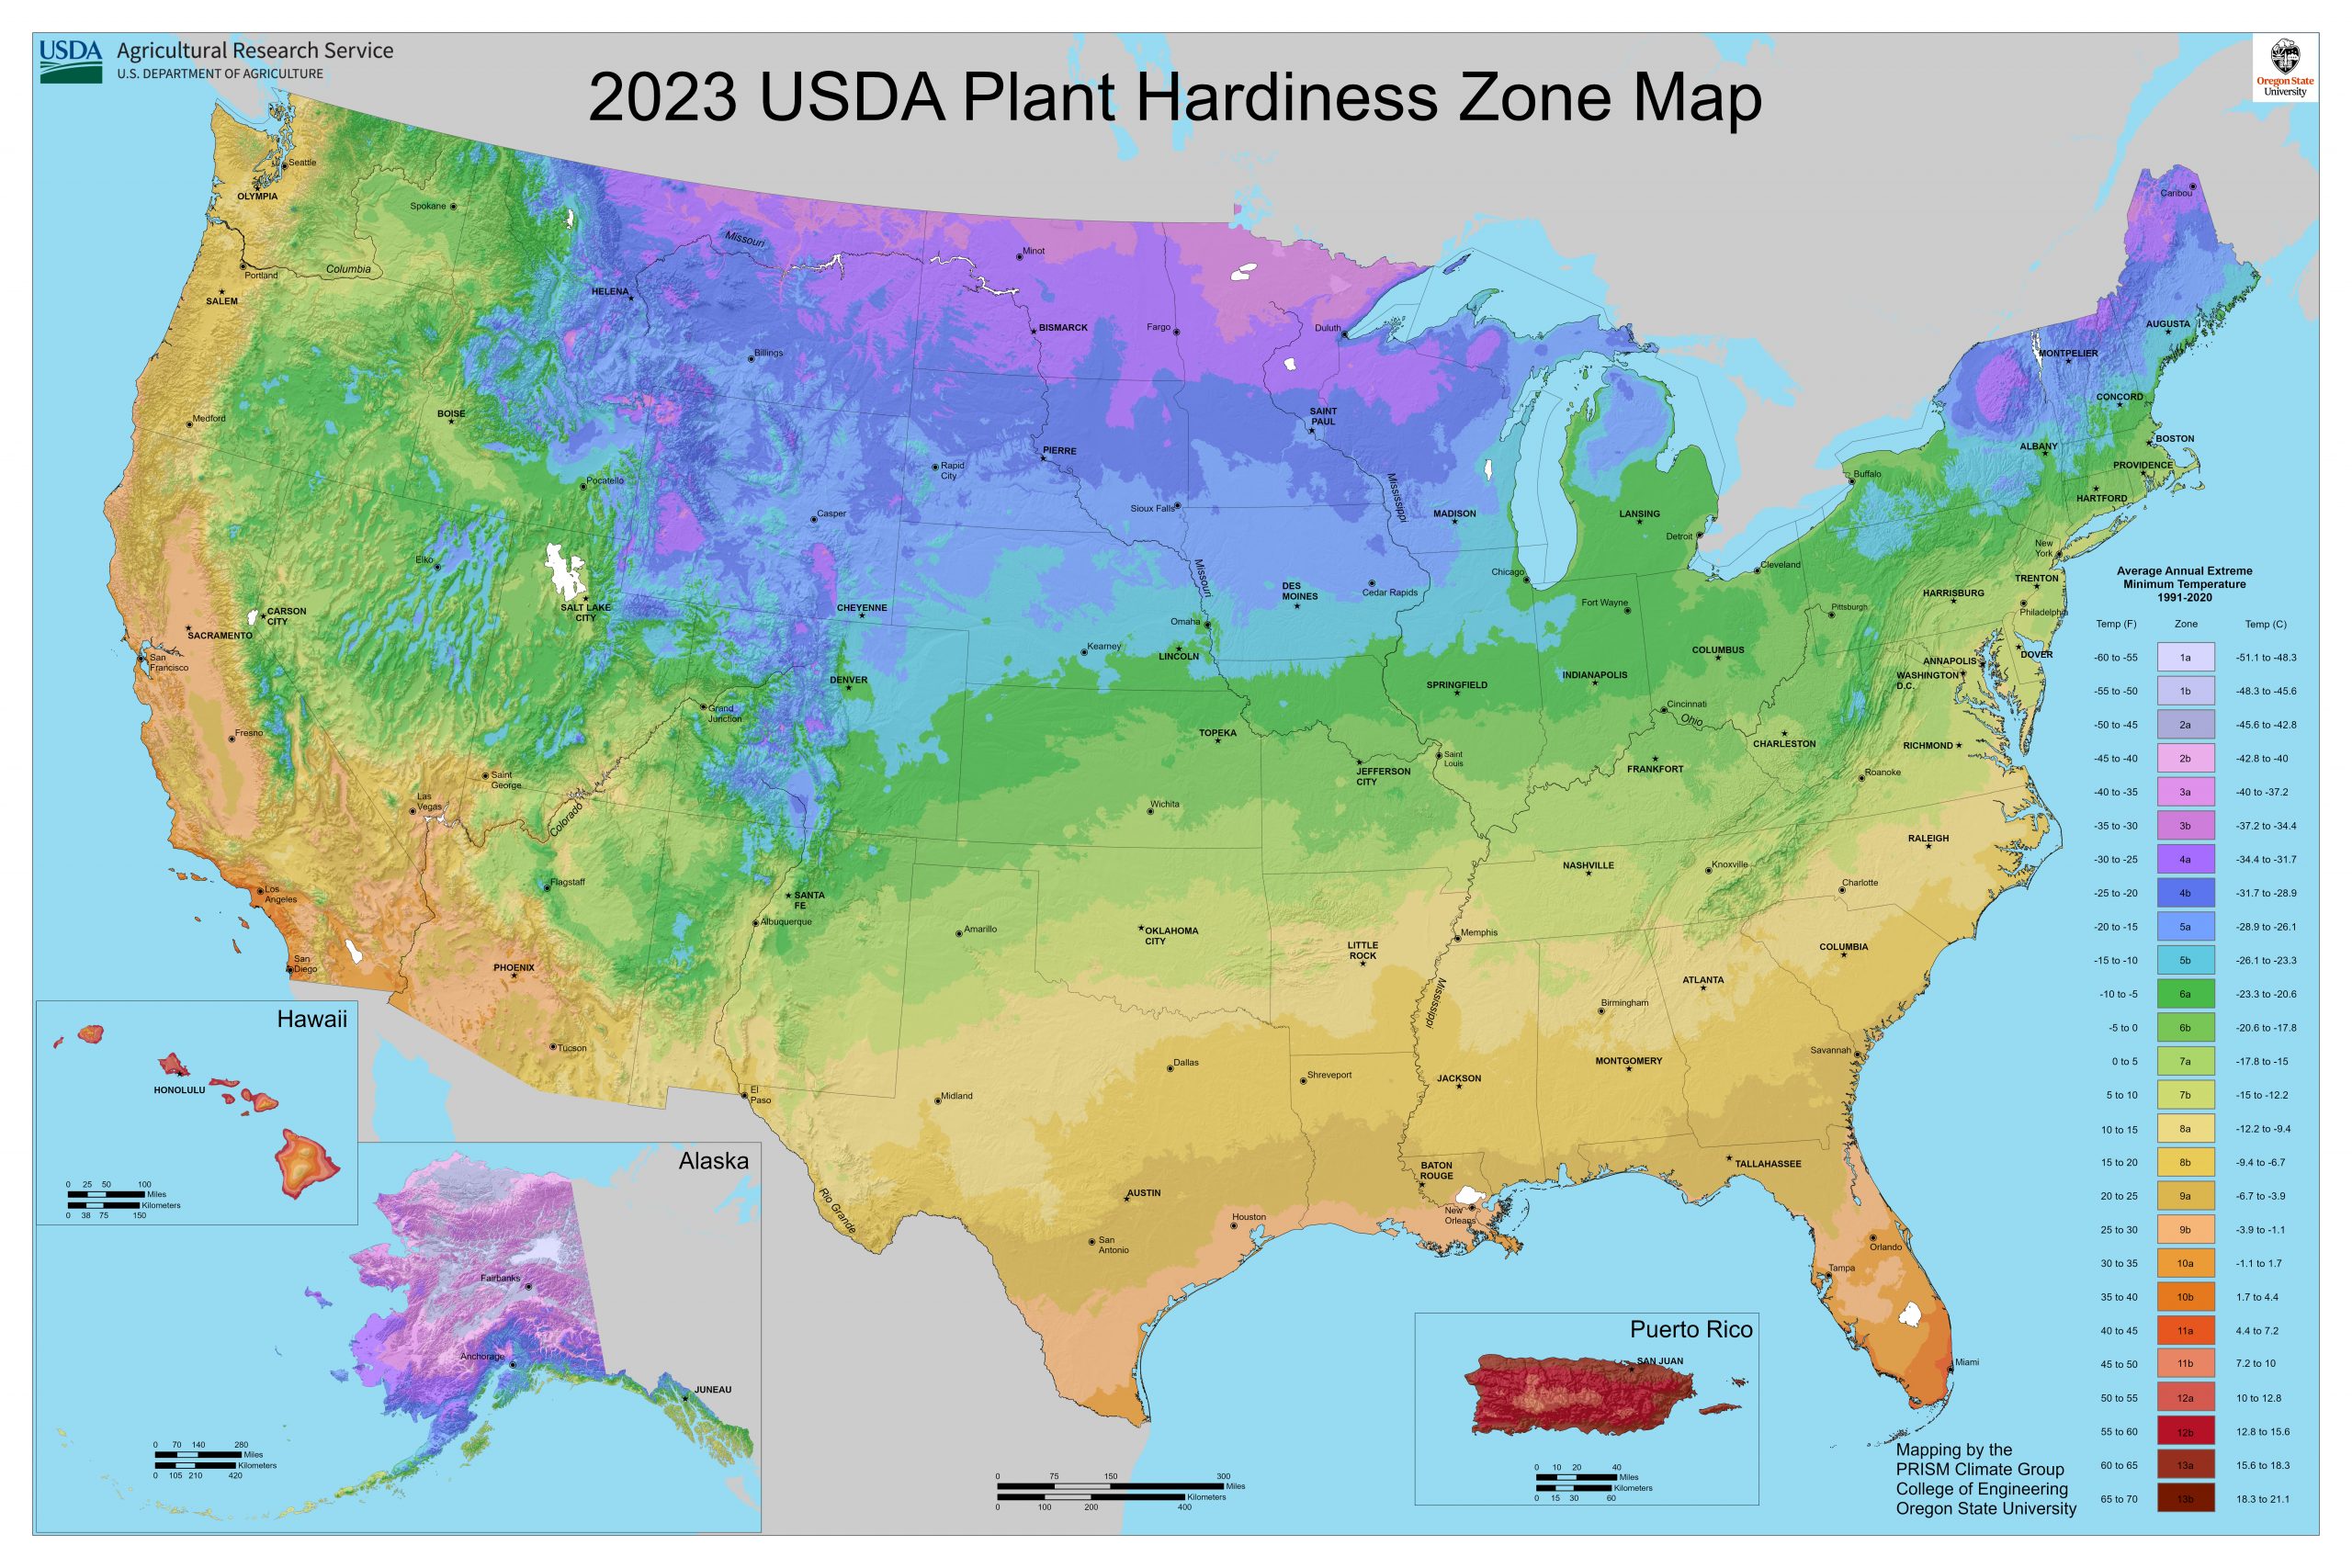
Since its initial release, the USDA Plant Hardiness Zone Map has been updated several times to reflect changes in climate and the availability of more accurate data. The latest update of the USDA hardiness map was released in November 2023, jointly developed by the USDA's Agricultural Research Service (ARS) and Oregon State University's PRISM Climate Group. This update incorporates data from 1991 to 2020, covering a broader range of weather stations than previous versions. One of the key findings from this update is that the contiguous United States has become approximately 2.5 degrees Fahrenheit warmer on average compared to the previous map. As a result, around half of the country has shifted into the next warmer half zone, while the other half has remained unchanged. The updated map still consists of 13 zones, but now offers more detailed information on temperature ranges within each zone, including 10-degree zones and 5-degree half zones. Connecticut has two hardiness zones each of which is divided into half zones; (6a,6b); (7a,7b), to better reflect the temperatures in the state over the past few decades.
The importance of hardiness zones lies in their ability to help gardeners and farmers choose plants that will thrive in their specific region. By selecting plants appropriate for their zone, growers can reduce the risk of frost damage and increase their chances of a successful growing season. However, due to unexpected temperatures outside the average range, there is no guarantee that a plant won’t suffer but it does reduce the risk of plant damage. In addition to gardeners, researchers use hardiness zones to study the spread of insects and exotic weeds, while the USDA Risk Management Agency uses the map to help determine crop insurance rates for commercial growers.
While the USDA Plant Hardiness Zone Map is an invaluable tool, it is important to note that it is not the only factor gardeners and farmers should consider when selecting plants. Other factors, such as soil type, precipitation, and local microclimates, can also impact plant growth and survival. Gardeners should use the map as a starting point and supplement it with local knowledge and research to make the best plant selections for their specific needs.
The development of the USDA Plant Hardiness Zone Map is a testament to the importance of adapting agricultural practices to local climates. Since its inception nearly a century ago, the map has evolved to reflect changes in climate and incorporate more accurate data. Today, the map remains an essential resource for gardeners and researchers alike, helping them to better understand and navigate the complexities of plant growth in the diverse regions of the United States. Knowing a plant’s hardiness zone when selecting that shrub, tree or flower will help you grow the garden of your dreams.
The UConn Home & Garden Education Center supports UConn Extension’s mission by providing answers you can trust with research-based information and resources. For gardening questions, contact us toll-free at (877) 486-6271, visit our website at homegarden.cahnr.uconn.edu, or reach out to your local UConn Extension center at cahnr.uconn.edu/extension/locations.
USDA Hardiness Zone Map 2023
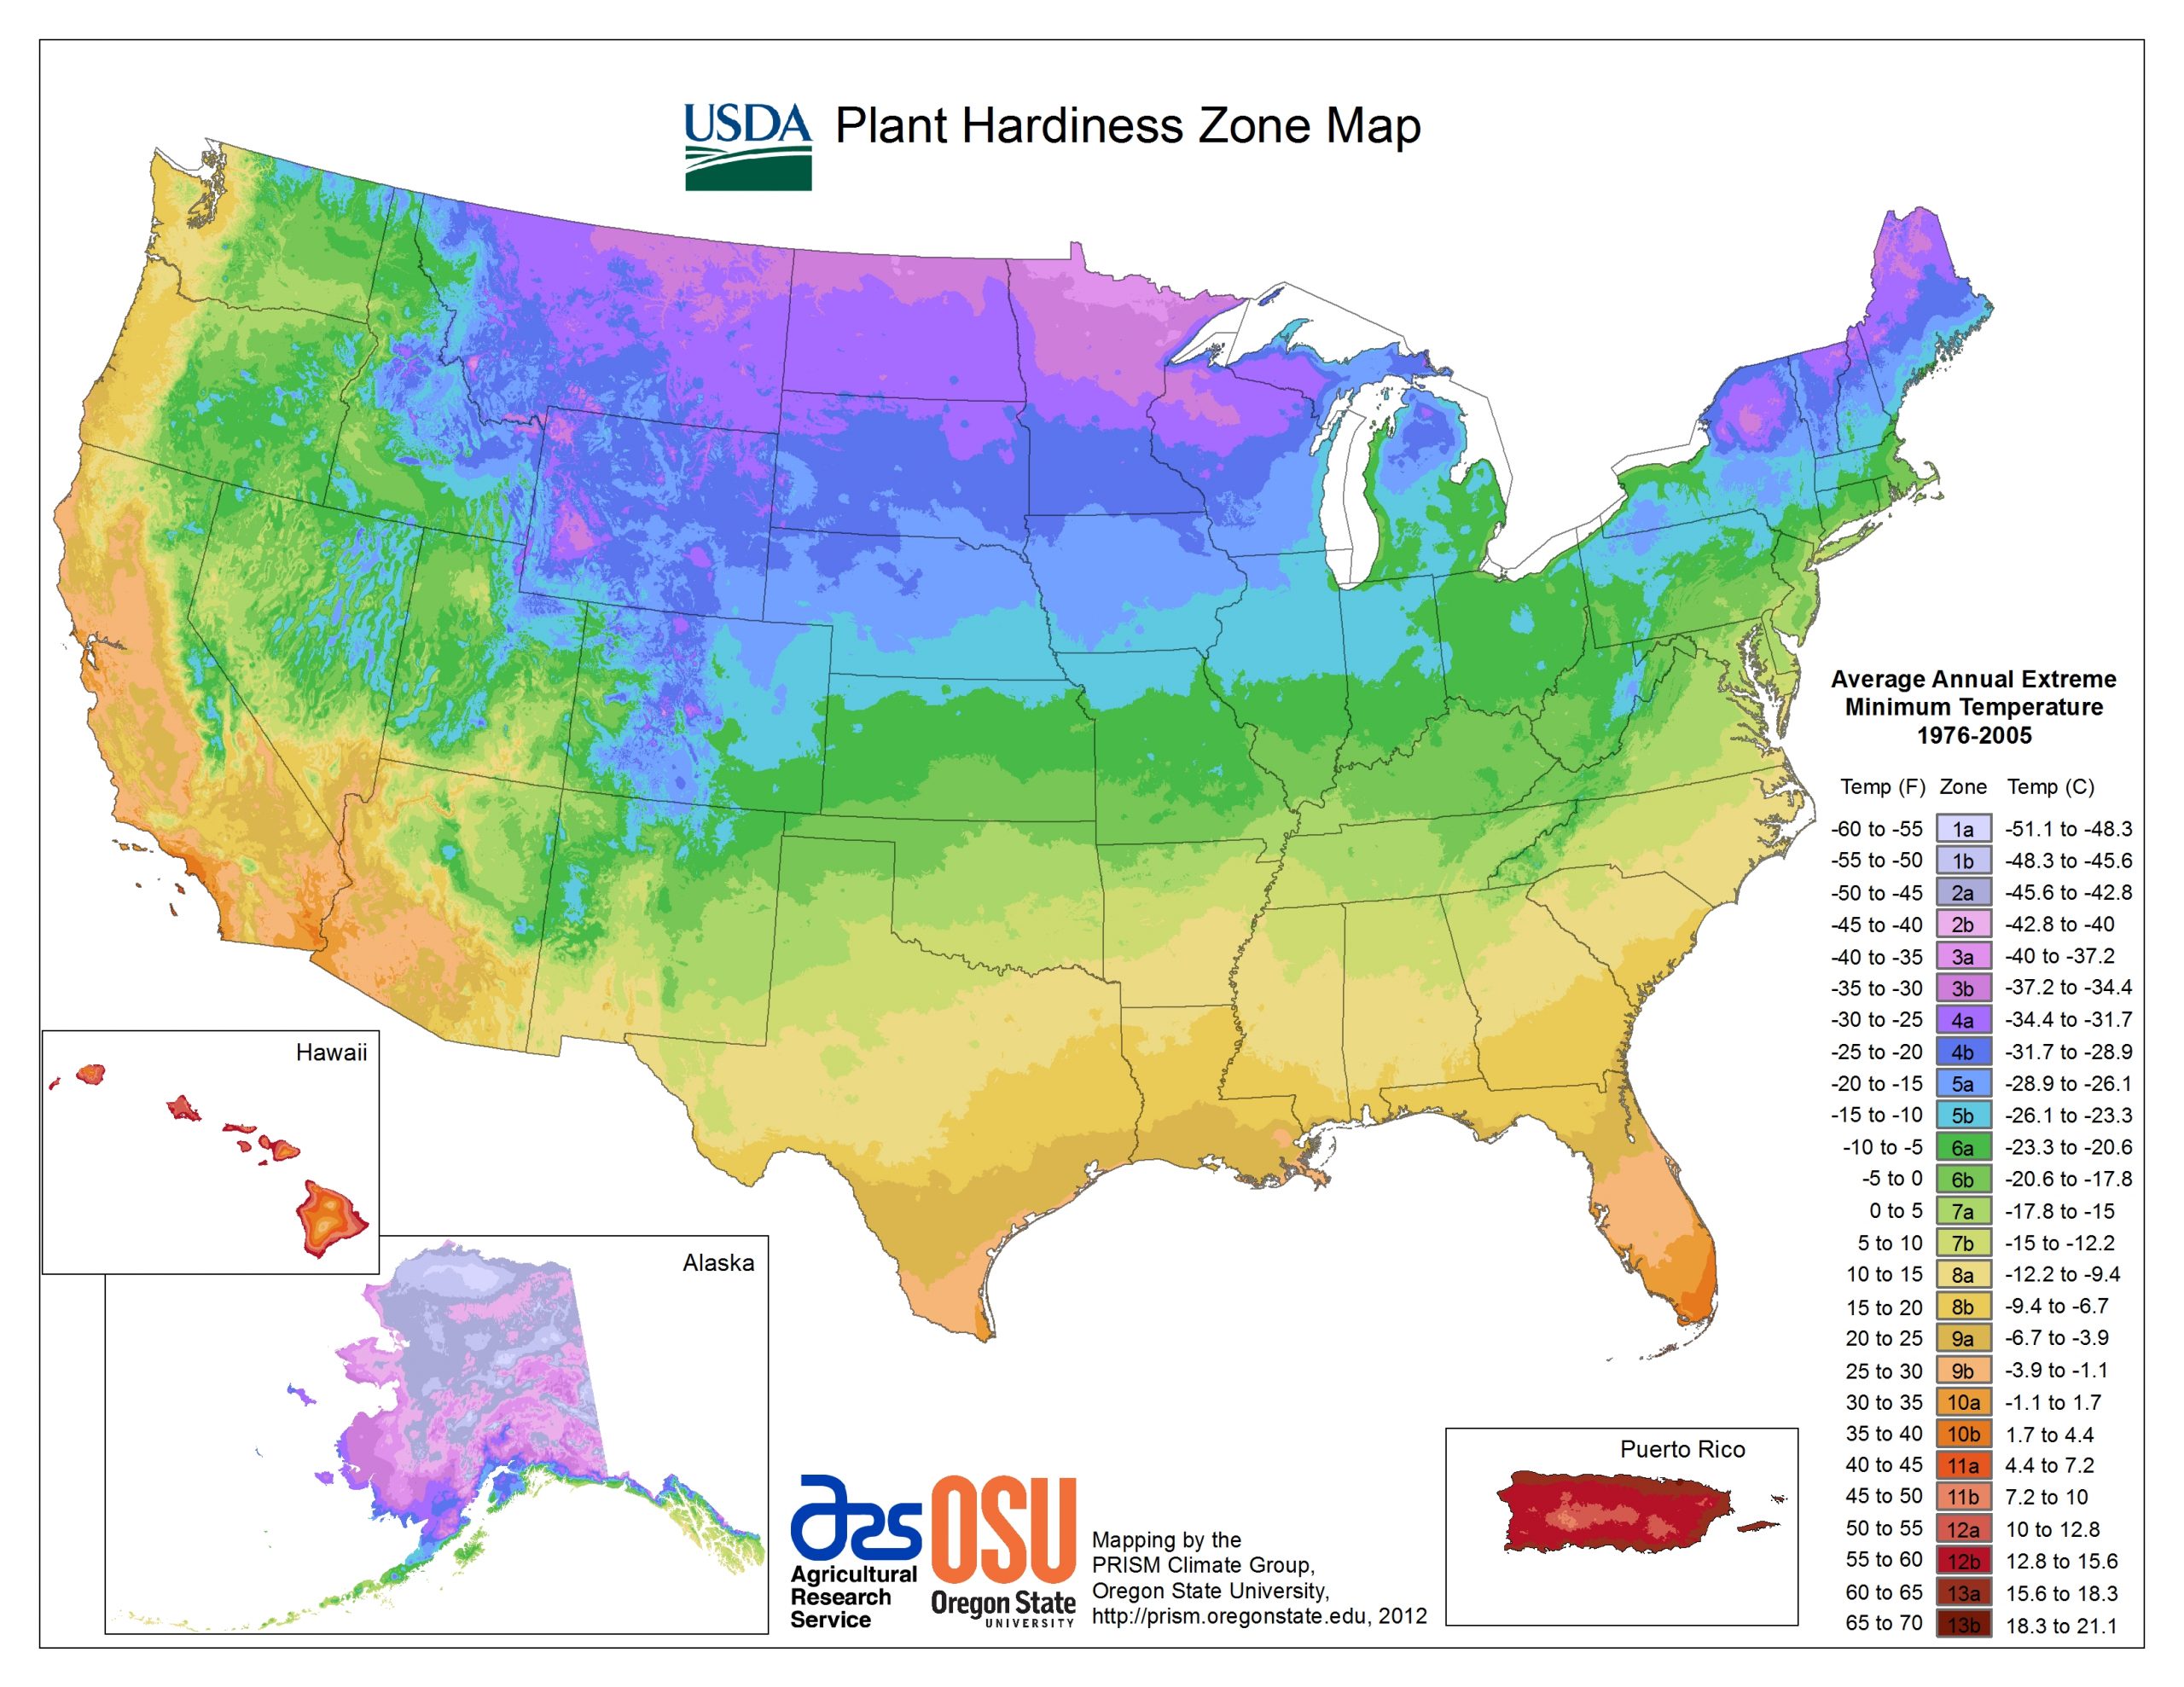
USDA Hardiness Zone Map 2012
USDA Hardiness Zone Map 1990